When inventory requests come in, you may not want to fulfill them blindly. You may want to consider what inventory is already in the requestor's custody, or how many they are selling, or how frequently you're sending them inventory.
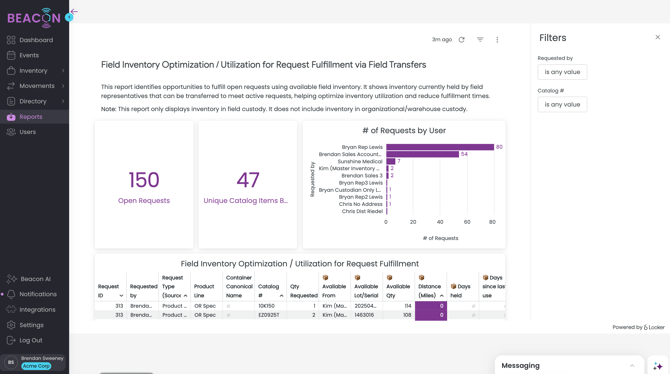
This report identifies opportunities to fulfill open requests using available field inventory. It shows inventory currently held by field representatives that can be transferred to meet active requests, helping optimize inventory utilization and reduce fulfillment times.
Note: This report only displays inventory in field custody. It does not include inventory in organizational/warehouse custody.
Available Filters:
- Requested by
- Catalog #'s
This dashboard Includes information such as: open requests, unique catalog items being requested, # of requests by user.
The report table itself includes: request ID, requested by, request type, product line, container canonical name, catalog #, qty requested, available from, available lot/serial, available quantity, distance, days held, days since last use.
To Export this Report Data:
- Click Refresh on the report table to apply filters

- Click on the vertical ellipse or Kabob menu that appears when you hover over the upper right corner (Tile Actions)

- Select Download Data
- Choose your File Type
- Change your download settings. The most common download for a .CSV or Excel file should use the following settings. It is critical to use these settings to ensure all of the data is able to export.
- In Results, select "With visualization options applied"
- In Data Values, select "Unformatted (no rounding, special characters, etc.)
- In Number of Rows to Include, select "All Results"
- This is very important as your data set may extend farther than Looker is able to display visually in Beacon, but you want to make sure to export all data.
- Click Download
