Beacon lets you review all angles of your business. Review inventory age reports to understand inventory creation over time. Transfer and request reports can give you a good understanding of inventory movement, and sales will show you inventory consumption. However, what if you want to understand the net impact of all activity on your inventory over a period of time? This can be particularly helpful if you are trying to reconcile inconsistencies in your data.
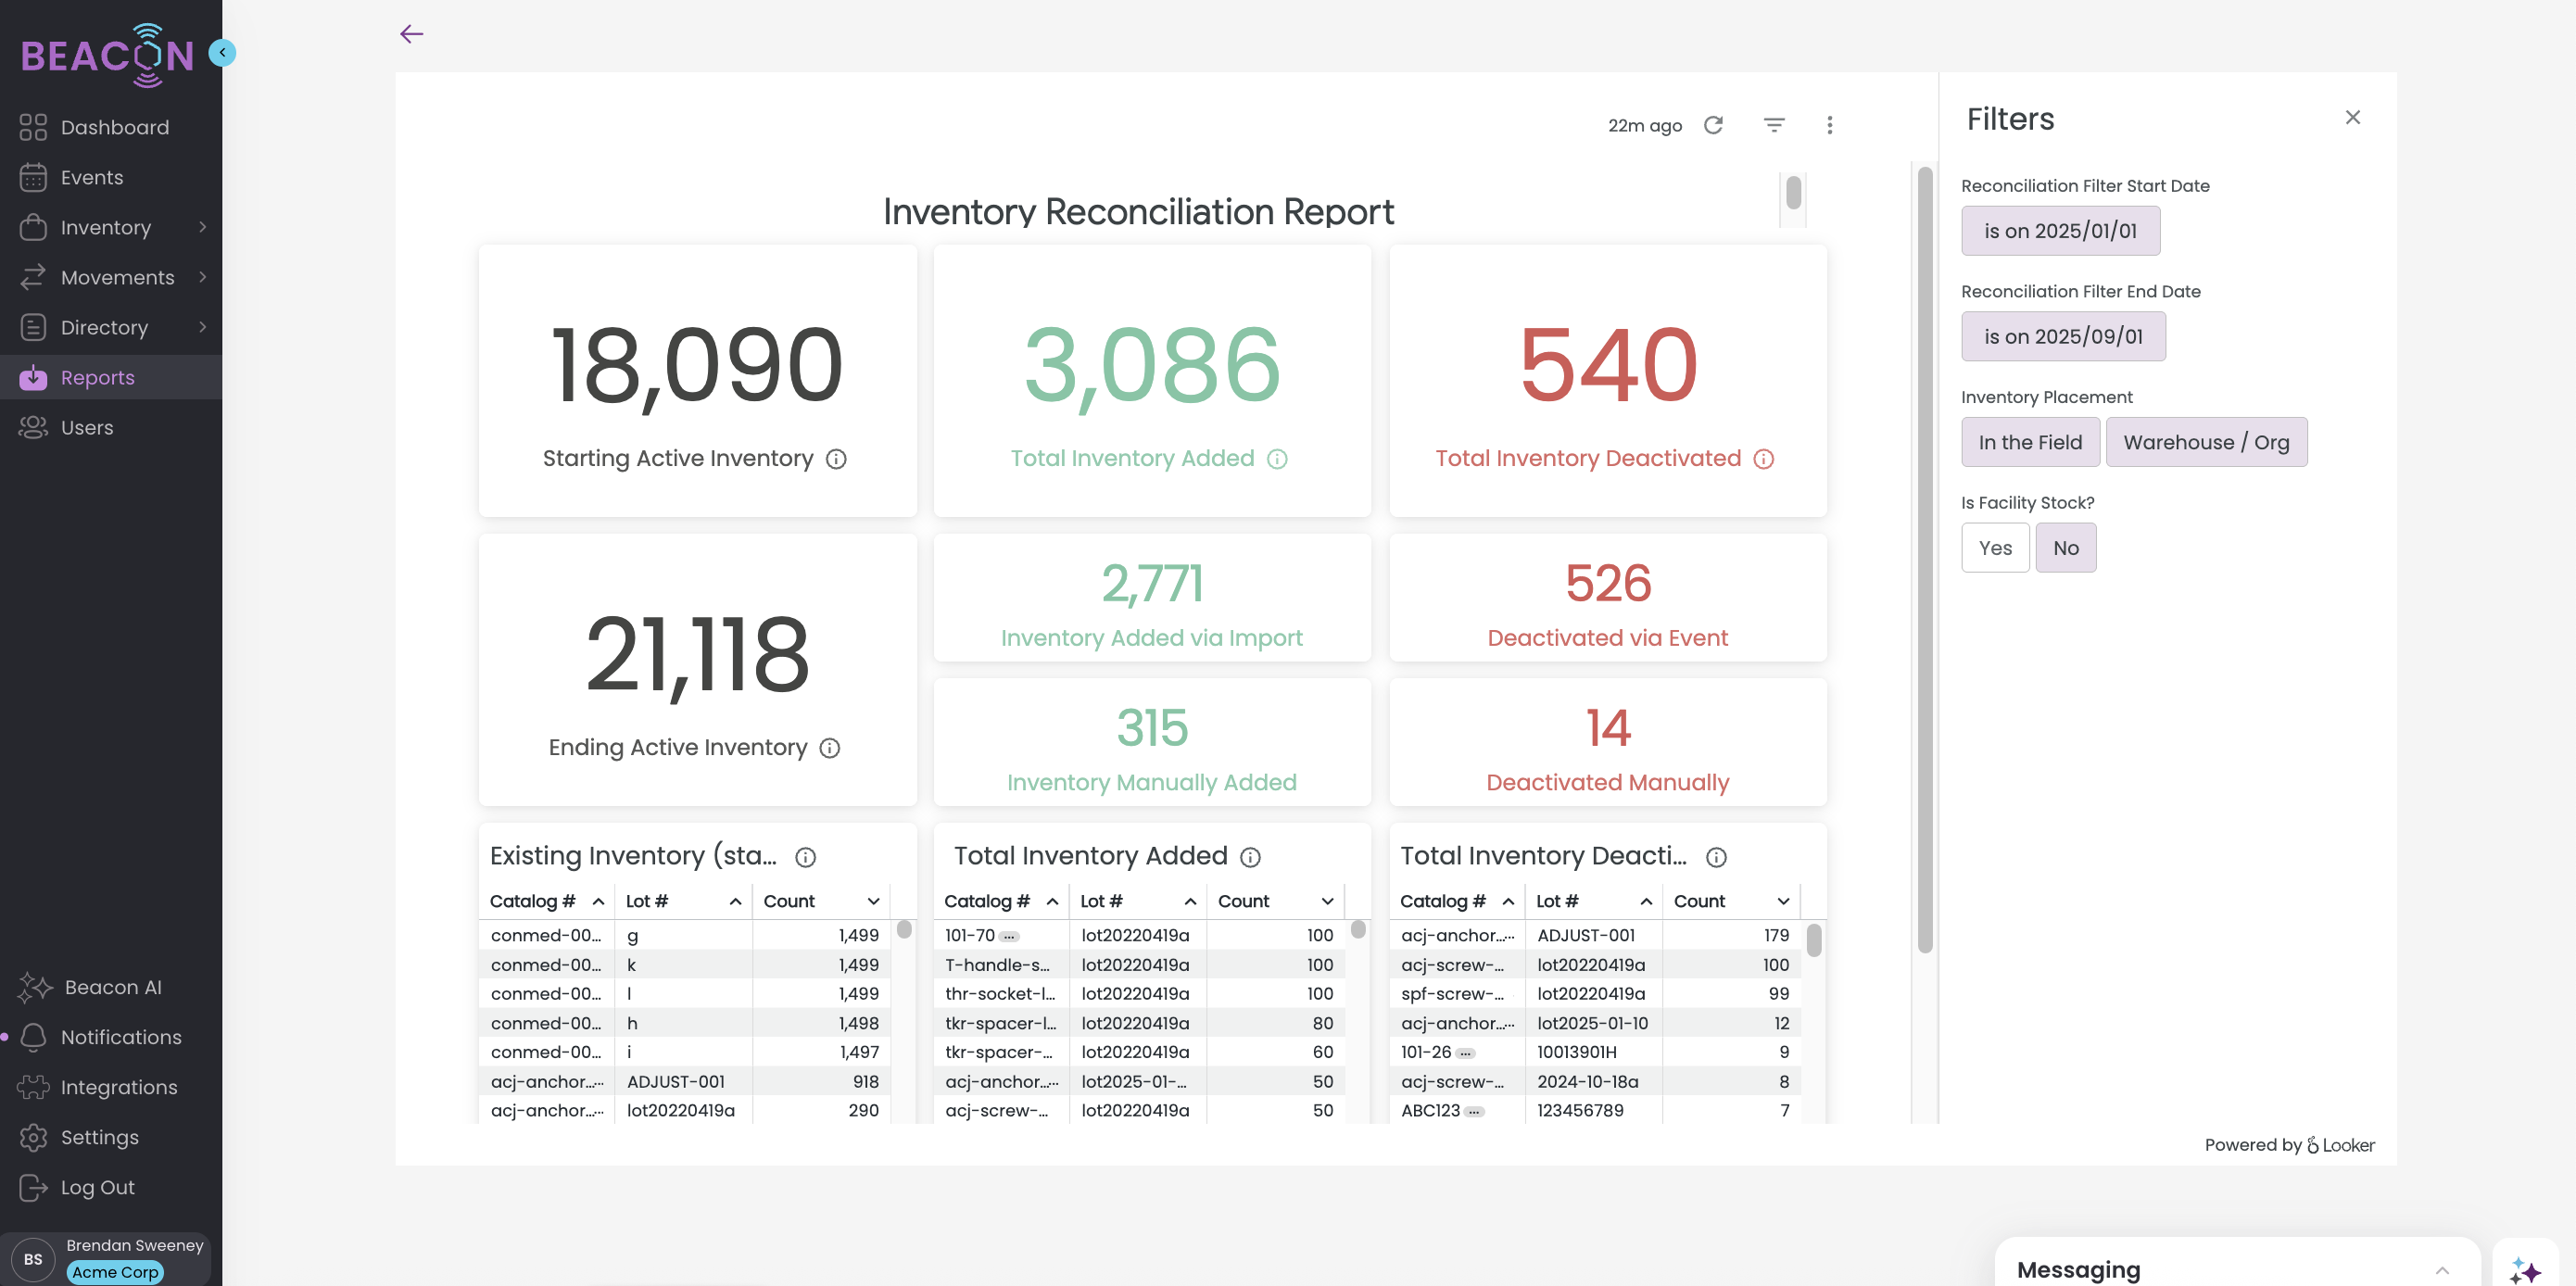
The Inventory Reconciliation Report provides a dynamic view of your inventory changes over a specified period. By entering start and end dates, you'll receive a clear comparison of inventory levels at both points in time. This report details additions and deactivations to your inventory during the selected timeframe.
Available Filters:
- Reconciliation Filter Start Date
- Reconciliation Filter End Date
- Inventory Placement (In the Field, Warehouse/Org)
- Is Facility Stock (Yes/No)
Statistics:
- Starting Active Inventory
- Ending Active Inventory
- Total Inventory Added (Between Start and End Date)
- Inventory Added Via Import (Between Start and End Date)
- Inventory Manually Added (Between Start and End Date)
- Total Inventory Deactivated (Between Start and End Date)
- Inventory Deactivated via Event (Between Start and End Date)
- Inventory Deactivated Manually (Between Start and End Date)
Included Reports:
This dashboard displays numerous reports to help you understand your changing inventory position. Each of these reports includes: catalog #, Lot #, and Inventory Count.
- Existing Inventory (starting): The total active inventory created on or before the start date.
- Total Inventory Added: The total inventory created on or between the start and end dates.
- Total Inventory Deactivated: The total inventory deactivated on or between the start and end dates.
To Export any of this report data:
- Click on the vertical ellipse or Kabob menu that appears when you hover over the upper right corner (Tile Actions)
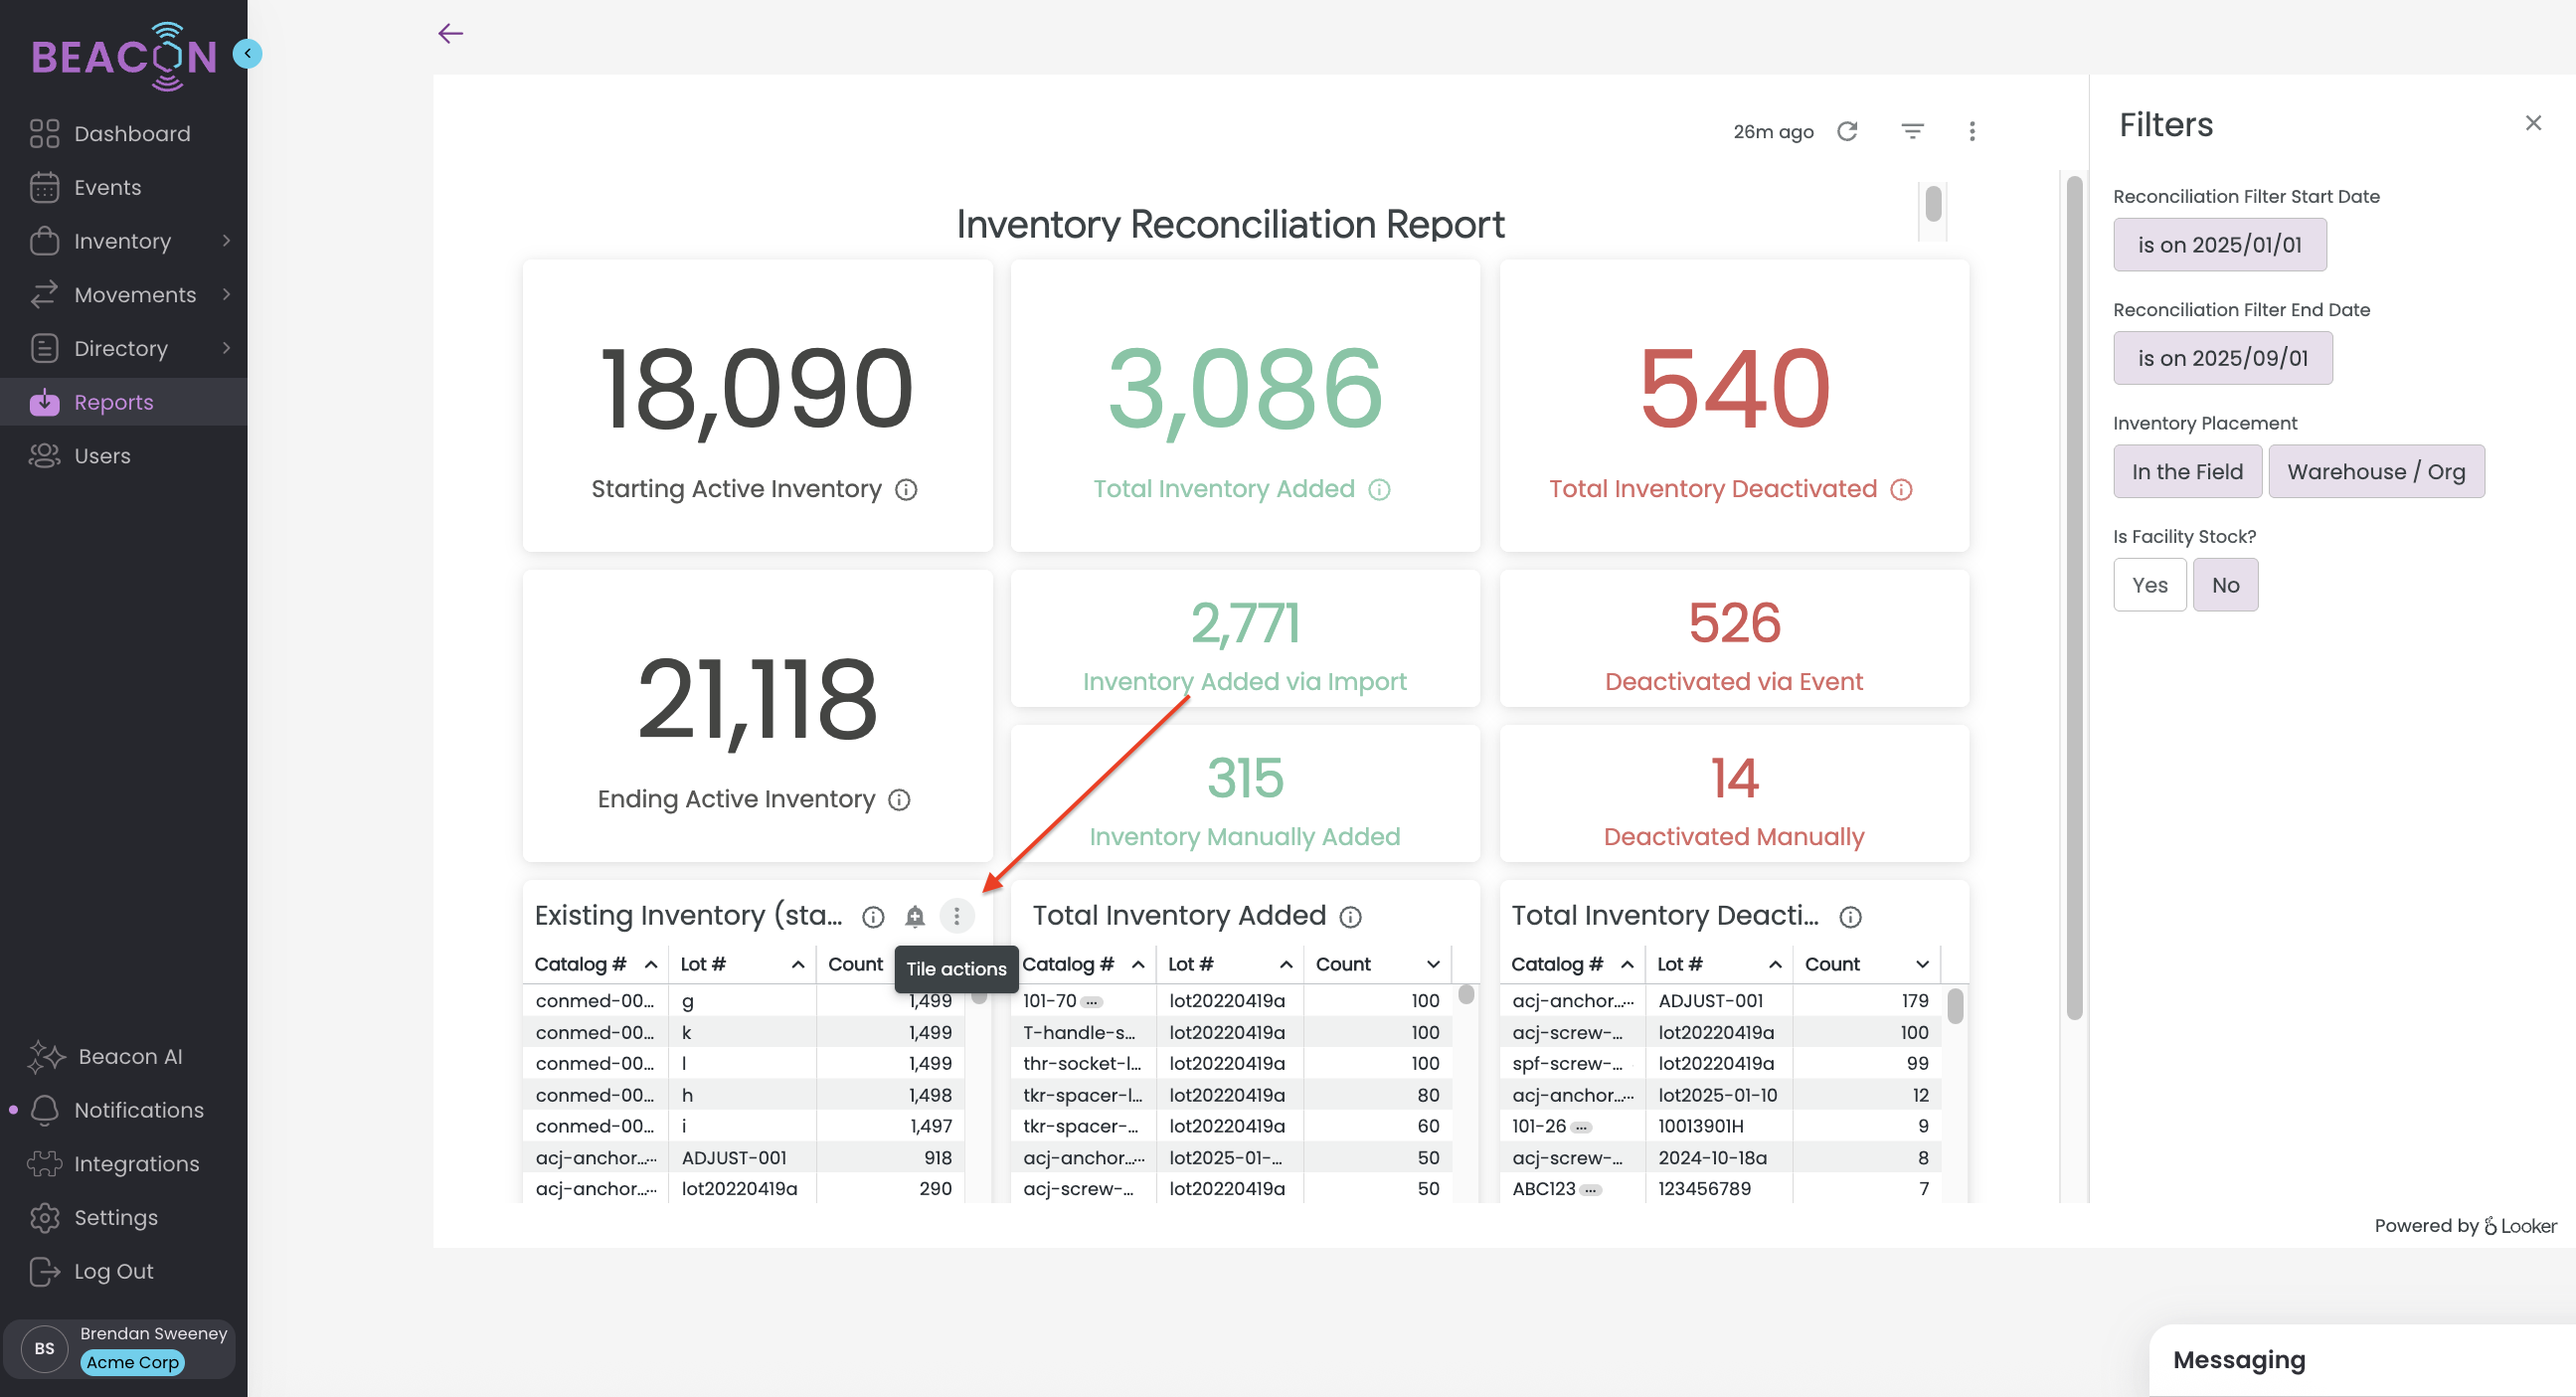
- Select Download Data
- Choose your File Type
- Change your download settings. The most common download for a .CSV or Excel file should use the following settings. It is critical to use these settings to ensure all of the data is able to export.
- In Results, select "With visualization options applied"
- In Data Values, select "Unformatted (no rounding, special characters, etc.)
- In Number of Rows to Include, select "All Results"
- This is very important as your data set may extend farther than Looker is able to display visually in Beacon, but you want to make sure to export all data.
- Click Download
