If you are using a lot of quotes, tracking your quote accuracy can help you to use your quote data to plan future demand.
Filters Available:
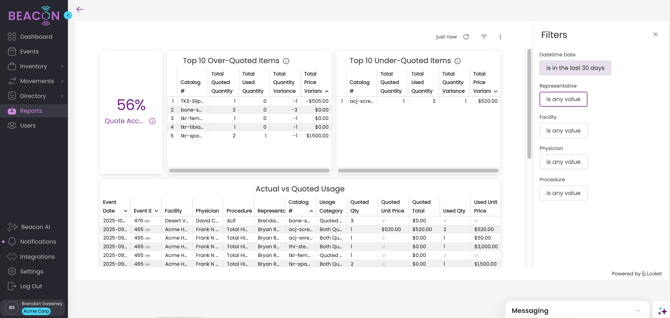
- Date
- Representative
- Facility
- Physician
- Procedure
This report will return information for you about your quoted items vs. what was actually used in the event including: Event Date, Event Id, Facility, Physician, Procedure, Representative, Catalog #, Usage Category, Quoted Quantity, Quoted Unit Price, Quoted Total, Used Qty, Used Unit Price, Used Total, Qty Variance, Price Variance to help you understand how accurate your Quotes have been over time.
To export, Click on the Kabob menu in the upper right corner of the report table titled, "Tile Actions", then select "Download"
Be sure not to click on the kabob menu at the top of the screen by mistake.
Then select the Advanced Settings:
- Results: With Visualization options applied
- Data Values: Unformatted (no rounding, special characters, etc.)
-
Number of Rows to Include: All Results
