Update: Check out the new Inventory Loan Extension Requests Dashboard Widget to make sure you don't miss out on any activity!

The ConnectSx Dashboards are the home screens for the platform - what you see when you first log in. There are a ton of helpful tools that give you quick access to your most important functionality in the system - this page walks you through what each Dashboard has to offer.
Using the Beacon Mobile Dashboard
Using the Beacon Mobile Dashboard
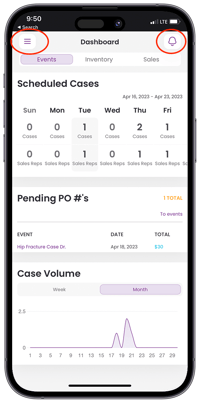
The Beacon Mobile App Dashboard provides a high level view of your cases, transfers, inventory statistics, and helpful shortcuts. There are 3 tabs on the dashboard: Events, Inventory, and Sales. You may navigate from one to another by selecting the appropriate tab at the top of the screen.
You can access the navigation menu by clicking the hamburger icon in the upper left of the screen and you can access your notifications by clicking on the bell icon in the upper right of the screen.
Each tab of the dashboard has related widgets displaying representations of your data aimed at helping give you a birds eye view of your account. In most cases clicking on the data will allow you to open up more detail about the data in another screen. The information displayed on the dashboards is listed below:
Events Tab:
-
Scheduled Cases for that week
-
Pending PO #'s: Displaying a list of cases that have outstanding POs
-
Case Volume: Filtered by week or Month

Inventory Tab:
-
Pending Inventory Requests
-
Pending Transfers
-
Inventory Statistics
- Inventory Loan Extension Requests
-Jun-03-2024-08-00-25-5485-PM.webp?width=200&height=403&name=image%20(6)-Jun-03-2024-08-00-25-5485-PM.webp)
Sales Tab:
-
Total Sales for your account: Filter the date range
-
Sales Targets & Performance annually
-Jun-03-2024-08-00-44-5907-PM.webp?width=200&height=403&name=image%20(7)-Jun-03-2024-08-00-44-5907-PM.webp)
Using the Beacon Dashboard
The ConnectSx Console Dashboard is your at-a-glance view of your cases and inventory. From this perspective you can see all cases by distributor and sales rep, as well as how your inventory is allocated.
First, the Dashboard is split into 3 different sections, which can be accessed by changing the tabs at the top of the page.
-Jun-03-2024-08-01-04-1631-PM.webp?width=670&height=386&name=image%20(8)-Jun-03-2024-08-01-04-1631-PM.webp)
Navigation
Note the navigation bar along the left of the screen allowing you to switch sections of the site (Dashboard, Events, Inventory, Users, and Directory).
On certain screens, under the navigation bar you’ll find a secondary navigation bar to move throughout that section of the site. For instance, in the Inventory screen you can navigate to different sub-screens (Inventory, Requests, Transfers, Import, and Products).
Notifications
On the Dashboard, clicking on the Notifications section in the lower left corner will display your recent notifications. Click “View All” to view previously viewed notifications. Use the tab toggle to switch to your @mentions.

What does Each Section have to offer?
Review the functionality of each tab below. Then, click the switch in the upper right corner on your favorite tab to make it your default tab for your Dashboard.
-Jun-03-2024-08-02-08-2289-PM.webp?width=670&height=357&name=image%20(9)-Jun-03-2024-08-02-08-2289-PM.webp)
Events Tab
Scheduled Cases This Week
Quickly view your upcoming cases that have been scheduled for this week. Click on a day to view the cases that are scheduled on that day. This stat module only displays events of the “case” type.
-Jun-03-2024-08-02-29-8225-PM.webp?width=670&height=386&name=image%20(10)-Jun-03-2024-08-02-29-8225-PM.webp)
Pending POs
A new feature has been added to the dashboard of the ConnectSx console that allows you to easily view and keep track of which events still need to have a Purchase Order number assigned to them.
On the dashboard look for the area marked “Pending PO#’s” along the right hand side. Here you will see the total of events lacking PO numbers and you can page through the list, while also viewing the total value of that Purchase Order and the event’s date.
-Jun-03-2024-08-02-40-9228-PM.webp?width=670&height=386&name=image%20(11)-Jun-03-2024-08-02-40-9228-PM.webp)
Case Volume
This section will show you a graph of changes in your case volume weekly or monthly.
-Jun-03-2024-08-02-54-3091-PM.webp?width=670&height=386&name=image%20(12)-Jun-03-2024-08-02-54-3091-PM.webp)
Inventory/Movements Tab
Requests/Transfers
Any inventory requests or pending transfers from the field will appear here. Click on the “Review” buttons to accept/decline transfers and manage inventory request fulfillment.
Accepting a transfer will add the devices to your inventory, declining will cancel the transfer and ask that you provide an explanation for rejecting the inventory.
To read about fulfilling inventory requests, please see the section on Fulfilling Inventory Requests on page 25. Inventory requests can be created using the vTrakr iOS app - please refer to the vTrakr User Guide for further instruction on creating inventory requests.
-Jun-03-2024-08-03-07-6894-PM.webp?width=670&height=386&name=image%20(13)-Jun-03-2024-08-03-07-6894-PM.webp)
Inventory Loan Extension Requests
This widget will display and link to Inventory Loan Extension Requests for users who are hoping to keep their inventory longer than the specified due back dates. You'll want to review these often and urgently to ensure users have what they need.

Expirations by Custody
This widget will display users that have expired inventory in their custody and how much.
-Jun-03-2024-08-04-28-1968-PM.webp?width=670&height=386&name=image%20(14)-Jun-03-2024-08-04-28-1968-PM.webp)
Top Items Sold by Catalog
You can now search for the top items sold for your account by entering a date range on the dashboard.
-Jun-03-2024-08-04-44-1844-PM.webp?width=670&height=357&name=image%20(15)-Jun-03-2024-08-04-44-1844-PM.webp)
Inventory Stats
View some at-a-glance inventory statistics, such as Total Inventory Value (sales value). Click on any stat to open the inventory screen to view that data.
-Jun-03-2024-08-04-57-2959-PM.webp?width=670&height=386&name=image%20(16)-Jun-03-2024-08-04-57-2959-PM.webp)
Quick Lookup
We created a sweet new feature that will allow you to quick-search items by item number directly in the dashboard! You now also have the ability to select multiple Catalog #s or Custodies!
-
Select the catalog number you’d like to view and you will see the quantity and COG of that item in the system.
-
Then, if you wish, you can enter a Custodian to further narrow the information displayed and view the inventory that is in a given user’s custody!
-Jun-03-2024-08-05-08-9899-PM.webp?width=670&height=386&name=image%20(17)-Jun-03-2024-08-05-08-9899-PM.webp)
Sales Tab
Sales Statistics
The console dashboard features modules to quickly access sales data. View Total Sales Amounts or Average Sales Per event. Modify the date ranges, or in the case of Total Sales select specific representatives, to further specify the data you wish to see.
-Jun-03-2024-08-06-17-3412-PM.webp?width=670&height=351&name=image%20(3)-Jun-03-2024-08-06-17-3412-PM.webp)
User Sales Target Performance Quick Lookup
This feature allows you to select a user and easily see their performance against their quarterly sales targets.
-Jun-03-2024-08-06-32-9196-PM.webp?width=670&height=357&name=image%20(4)-Jun-03-2024-08-06-32-9196-PM.webp)
ConnectSx User Activity
You can look here to see your organization’s activity levels in different arenas and for different tasks. Modify the date range to view stats for a given period of time.
-Jun-03-2024-08-06-43-7947-PM.webp?width=670&height=357&name=image%20(5)-Jun-03-2024-08-06-43-7947-PM.webp)